
 @itaysk
 itaysk
 itaysk
Kubernetes Metrics and Monitoring
This post explores the current state of metrics and monitoring in Kubernetes by walking through the gradual thought process that I experienced when learning this topic.
Recap
I don’t want to spend too much time on history, so here’s a quick recap of recent events in this domain:
- Kubernetes needs some metrics for it’s basic out-of-the-box functionality, like autoscaling and scheduling. This is regardless of any monitoring solution you may want for the purpose of troubleshooting and alerting. The case for Kubernetes is often being referred to as the ‘core metrics pipeline’ in contrast to a general monitoring solution.
- Heapster was a cluster wide resource aggregator that Kubernetes depended on which is now deprecated.
- Kubernetes introduced a new API for describing metrics - the ‘Metrics API’. This is just a spec, not an implementation. Implementors provide a webserver that adheres the the spec, which is incorporated into the Kubernetes API by leveraging Kubernetes API aggregation. The spec describes the following types of metrics:
- Resource metrics: Resource usage metrics for pods and nodes (e.g. CPU for a pod).
- Custom metrics: Arbitrary metrics for Kubernetes objects (e.g. requests for a service).
- External metrics: Metrics unrelated to Kubernetes that you still want to incorporate into the Kubernetes core metrics pipeline.
- metrics-server was introduced as a Kubernetes component that implements the new metrics API for resource metrics (thus replacing Heapster). It’s expected to be included in modern Kubernetes distributions, but currently it’s usually an add-on.
- There is variety of 3rd party adapters that expose metrics from different kinds of data stores as Kubernetes metrics API.
- Pod autoscaler (HPA) was limited to only basic metrics and was revised to now leverage the Kubernetes metrics API.
- Prometheus is the de-facto standard monitoring solution (not core metrics pipeline) for Kubernetes. Kubernetes itself is instrumented for Prometheus, and there are abundant exporters for this ecosystem.
The purpose of this post is not to dive into the above mentioned concepts, but to help you understand the big picture; how they and other projects you may have encountered in this space fit together and to what end.
Basic Kubernetes setup
So based on the recap, and based on most guides/tutorials you would find, a standard monitoring and core metrics pipeline for Kubernetes will look something like this:
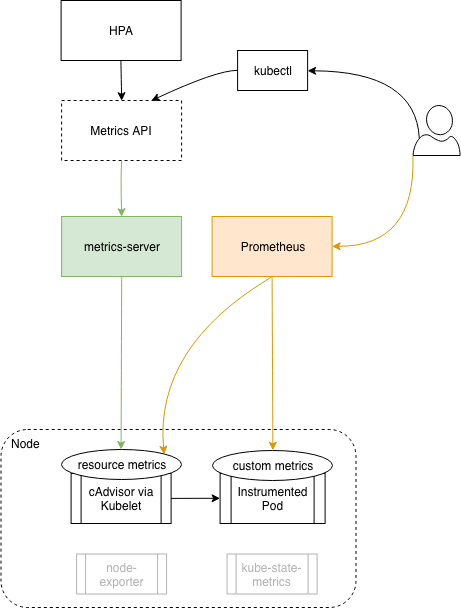
- We have metrics-server in the cluster to allow basic Kubernetes functionality.
- We also have Prometheus as a monitoring solution.
- There may be additional Prometheus exporters in use.
Basic + Cloud
More often than not, our Kubernetes cluster is part of a larger environment which is monitored independently. For example: we use a managed kubernetes service in a cloud platform, our cloud environment has many other components (or entirely different systems) so we have been using the cloud provided monitoring solution to monitor our cloud environment. At this point we have two separate monitoring systems.
Let’s add another (fairly common) component to the scenario, our Kubernetes based application uses some cloud provided ‘as-a-service’ component, like a database or a queue. The service is natively monitored by the cloud provider monitoring solution which we already use. We also need to include those metrics on the Kubernetes core metrics pipeline. Example: our app uses a cloud queue and we would like HPA to autoscale pods based on the queue length metric.
Our monitoring pipeline now looks like this:
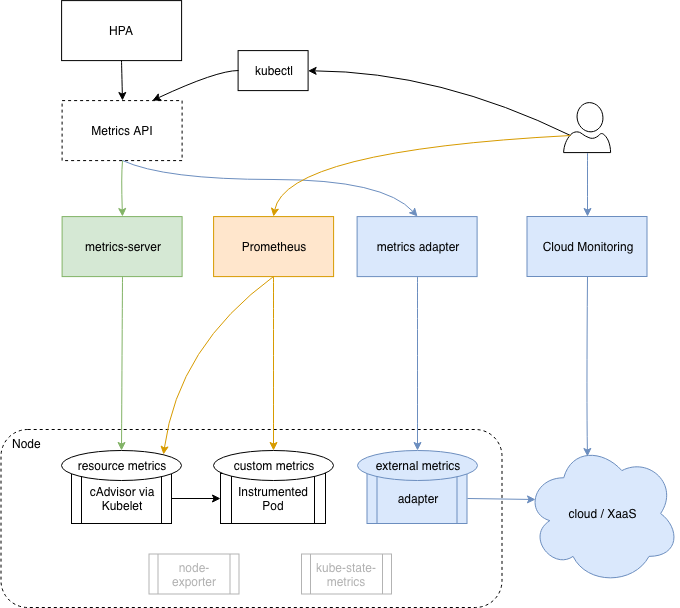
- We still have everything from the basic setup (metrics-server + prometheus)
- We also use the cloud provided monitoring solution.
- We have a metrics adapter that exposes additional cloud metrics through the Kubernetes metrics API.
Cloud Centric
If we have a good monitoring tool in our cloud that we already use to monitor our cloud environment, can’t just use it to monitor Kubernetes as well? Can we replace Prometheus with the cloud provided monitoring tool? The answer depends on the monitoring tool in question but it’s reasonable to expect your tool to be able to monitor Kubernetes, many tools does that. So generally the answer is yes, you could replace Prometheus with your existing monitoring tool, and consolidate your concerns into a single tool.
But what about the Kubernetes core metrics pipeline? It’s still relies on metrics-server and additional adapters which presents an overlap with the monitoring solution. Can we just make Kubernetes rely on the external monitoring solution for it’s required metrics? In theory yes, they could build a metrics API adapter that exposes the relevant metrics from the monitoring system through the Kubernetes metrics API. But in practice I am not aware of such solutions.
If there were such Cloud Centric monitoring solution for Kubernetes it would work like this:
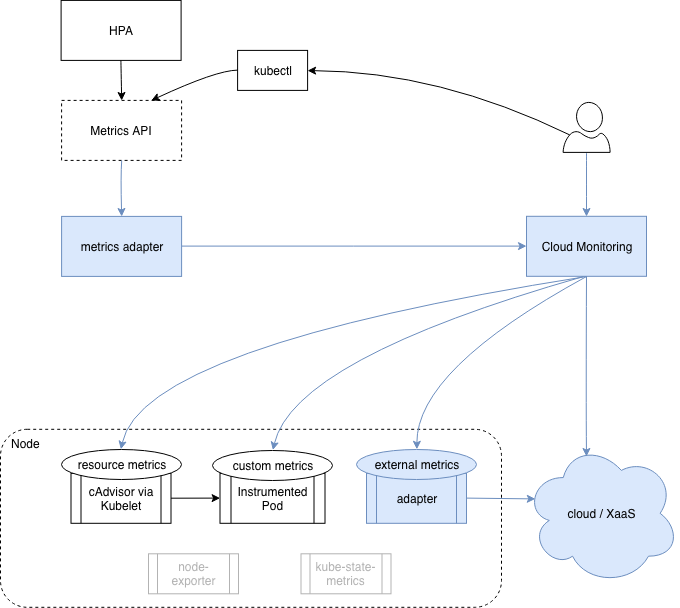
- We don’t have anything from previous approaches, no prometheus and no metrics-server.
- Our cloud provider monitoring tool monitors our cloud platform, Kubernetes cluster, application code, and everything in between.
- We use our cloud provider monitoring solution exclusively.
- There’s a metrics adapter in the cluster that exposes all required metrics through the Kubernetes metrics API.
Prometheus centric
What if instead of merging Prometheus into the cloud monitoring, we merge the cloud monitoring into Prometheus? We probably still need the cloud monitoring system to collect the cloud services metrics in the first place because of the way things are wired in the cloud, but we sure can import those metrics into Prometheus! Prometheus exporters are abundant and it’s reasonable to expect to find one that export your cloud metrics of choice.
Does this mean you can forget about the cloud monitoring solution and use Prometheus exclusively? Probably not, but I do believe that it is possible to reach a state where most of your time is spent in Prometheus and the cloud monitoring solution is only occasionally used.
And what about the Kubernetes core metrics pipeline? Can we replace metrics-server with data that Prometheus already had? Yes, k8s-prometheus-adapter is a metrics adapter that does that.
So in this scenario our setup looks like this:
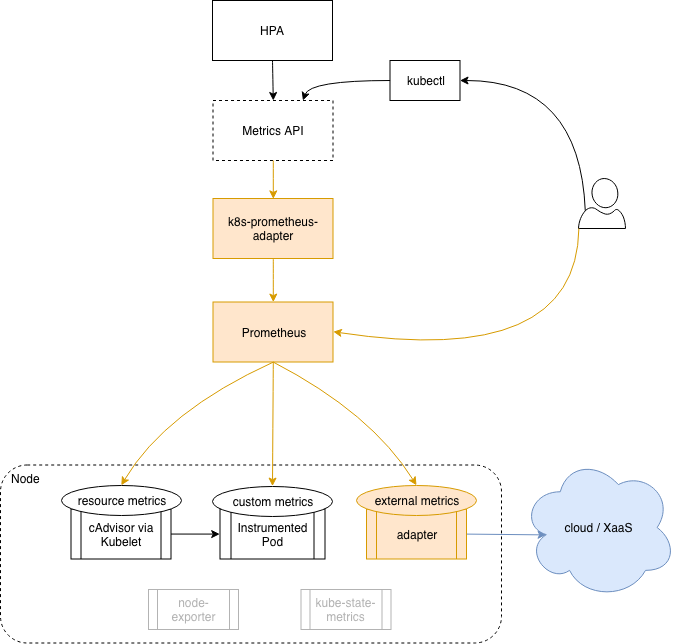
- Prometheus monitors our Kubernetes cluster, and we import what we need from the outside.
- We use Prometheus for monitoring.
- k8s-prometheus-adapter exposes all required Prometheus metrics through the Kubernetes metrics API.
Conclusion
I would like to see how the new monitoring and metrics pipelines evolve in Kubernetes, and the industry. Currently things are still taking shape, and from the options presented here, I think that the Prometheus Centric approach make the most sense. It allows me to use Prometheus as a monitoring solution (which is a good thing given it’s prominent place in the Kubernetes ecosystem), while at the same time provides the simplest architecture for supporting Kubernetes core metrics pipeline.
Notes
- The case for cloud provider monitoring solution is relevant for other SaaS monitoring solutions(think DataDog).
- The case for cloud provider service dependency is relevant for external services (think MLab managed MongoDB)
- The diagram places the adapters and provider outside the node although they run on the node as well. It was just clearer to depict this way.
- This following document basically explains the same things as this post does in a more formal way. I recommend reading it as well as the rest of the links in this post. https://github.com/kubernetes/community/blob/master/contributors/design-proposals/instrumentation/monitoring_architecture.md
- This topic is still in motion and some of the stuff discussed here are beta/incubating. Still, it’s clear that this is the direction the project is taking.