
 @itaysk
 itaysk
 itaysk
eBPF lost events
Lately I’ve been working on re-writing Tracee from Python to Go. Tracee is a system tracing tool based on eBPF, a Linux technology that we used for collecting the events in the kernel (for an introduction to eBPF see here). Tracee is using the bcc project to easily work with eBPF.
During the migration from Python to Go, we moved from using bcc’s python library to the gobpf library, which was supposed to offer similar functionality to the bcc’s Python library. However, during the migration we have noticed a missing functionality in the gobpf library - the ability to handle “lost events”. In this post we’ll discuss what exactly are those lost events and how we implemented this missing feature in gobpf.
perf ring buffer
Before we continue, we need to understand how events we collected with eBPF make their way to our program. eBPF runs in the kernel, and there are several mechanisms to communicate information between kernel-space and users-pace but the most common for eBPF, and what ‘bcc’ is recommending, is the ‘perf’ subsystem. perf predates eBPF, and have been used to collect performance measurements from the OS (and from hardware) for a long time. In order to communicate performance data, perf offers a mechanism based on a ‘ring buffer’.
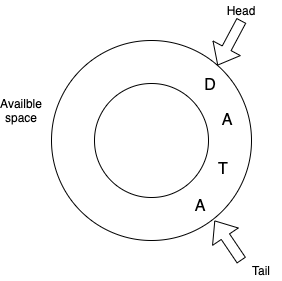
A ring buffer (a.k.a circular buffer) is a contiguous memory area that the producer and the consumer can read and write to simultaneously. It’s called “ring” because once the buffer has filled, the producer will continue to write data at the beginning of the buffer, so a fixed sized ring buffer could potentially accommodate an infinite stream of events. But what happens when the buffer is filled and the consumer has not (yet) read it’s data? Depending on the implementation, the producer will overwrite existing data, or lose the event.
In order to understand what happens in bcc, we will track the flow of code from the lines we wrote in bcc, down the layers of abstraction to the perf ring buffer.
Tracking the code
In your Python code, you are instructed to instantiate a BPF class and:
- Initialize buffer using the
BPF.open_perf_buffermethod - Start receiving events using
BPF.perf_buffer_pollmethod
Section 1 - BPF.open_perf_buffer
- The user program is opening a perf buffer using the
BPF.open_perf_buffermethod which receives alost_cbcallback (function pointer): (source)def open_perf_buffer(self, callback, page_cnt=8, lost_cb=None) BPF.open_perf_bufferends up creating a “reader” using theperf_reader_newC function. “reader” is a bcc construct that facilitates reading from a buffer. Appendix 1 walks through this code path.perf_reader_newC function is saving the callback in the newly created reader: (source)reader->lost_cb = lost_cb;
This shows us what the system does with the lost events callback that we provided - it was just registered with the appropriate reader. When is this callback called? Let’s move on to look at the other method we mentioned.
Section 2 - BPF.perf_buffer_poll
- The user program is calling
BPF.perf_buffer_pollmethod to start receiving events. This is using bcc’s C functionperf_reader_pollto read from the previously created “reader”: (source)lib.perf_reader_poll(len(readers), readers, timeout) perf_reader_pollis invoking the read function on every reader: (source)perf_reader_event_read(readers[i]);perf_reader_event_readis reading an event. If it’s type isPERF_RECORD_LOST, it will call our lost events callback: (source)if (e->type == PERF_RECORD_LOST) { ... reader->lost_cb(reader->cb_cookie, lost); ... }
So now we know that our lost events callback was triggered when bcc found events of type PERF_RECORD_LOST. But we never submitted events of this type. All we did in our eBPF program was use the perf_submit function. How did those event got there? Let’s look at what happens when we submit events.
Section 3 - perf_submit
To submit events from our eBPF (C) program, we are instructed to initialize a “table” using the BPF_PERF_OUTPUT macro, and then call the perf_submit bcc C helper function.
- The user eBPF program is using
BPF_PERF_OUTPUTto define a struct. The created struct holds a pointer to theperf_submitfunction: (source:) - The user eBPF program calls
table.perf_submit()to submit an event bpf_perf_event_outputends up callingperf_event_outputfunction from the perf subsystem. Appendix 2 walks through this code path.perf_event_outputcallsperf_output_beginfunction before it actually submits an event. (source)perf_output_beginkernel function is the one that creates the “lost events”: (source) ```c struct { struct perf_event_header header; u64 id; u64 lost; } lost_event;
if (unlikely(have_lost)) { … lost_event.header.type = PERF_RECORD_LOST; … }
What is this `have_lost` indicator? Let's dig (final stretch, bear with me):

### Section 4 - Tracking the ring buffer's `have_lost` indicator

If we look at the `perf_output_begin` function from the kernel's perf ring buffer implementation:
1. `have_lost` variable is holding the ring buffer's `lost` field: [(source)](https://elixir.bootlin.com/linux/v4.5/source/kernel/events/ring_buffer.c#L134)
```c
have_lost = local_read(&rb->lost);
- There’s a check if there’s enough space in the ring buffer (and also the buffer is configured to not overwrite), then we go to
fail: (source)if (!rb->overwrite && unlikely(CIRC_SPACE(head, tail, perf_data_size(rb)) < size)) goto fail; - Under
fail,rb->lostis being incremented: (source)fail: local_inc(&rb->lost);
That’s it! we have found out that “lost events” are events that couldn’t be written to the perf ring buffer because there wasn’t enough space. When this happens, the bcc “reader” will call the callback that was given to it when it was created.
To recap:
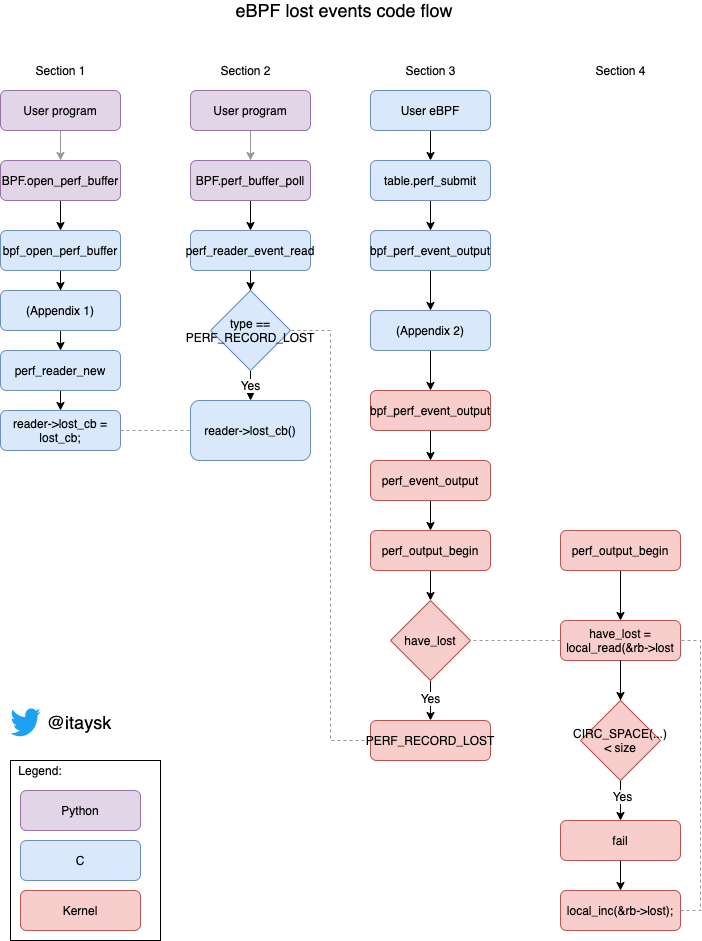
You can follow along the dotted line from end to start to visualize the logical chain.
Lost events in gobpf
Now that we know what are lost events, let’s get back to our original problem that gobpf didn’t ask us for a lost callback. Here’s the fix that I submitted: https://github.com/iovisor/gobpf/pull/235. Let’s review it:
The change is contained in the bcc/perf.go file. This time I will not go through every single step because this change is more readable. The highlights are:
- change
callbackDatastruct to contain a lost channel in addition to the main channel:callbackDataIndex := registerCallback(&callbackData{ receiverChan, lostChan, }) - change the signature of the
InitPerfMapuser facing function making it also accept a channel for lost events:func InitPerfMap(table *Table, receiverChan chan []byte, lostChan chan uint64) (*PerfMap, error) { - in the call to the lower level bcc C function
bpf_open_perf_buffer, pass the registered lost callback:reader, err := C.bpf_open_perf_buffer( (C.perf_reader_raw_cb)(unsafe.Pointer(C.rawCallback)), (C.perf_reader_lost_cb)(unsafe.Pointer(C.lostCallback)), unsafe.Pointer(uintptr(callbackDataIndex)), -1, cpuC, pageCntC)
Further reading:
- [Linux: circular-buffers]https://www.kernel.org/doc/Documentation/circular-buffers.txt
Appendix
Appendix 1 - from BPF.open_perf_buffer to perf_reader_new
BPF.open_perf_buffermethod is calling into bcc’s C functionlib.bpf_open_perf_buffer(source)bpf_open_perf_bufferfunction is creating a reader usingperf_reader_newfunction (source)
Appendix 2 - from bpf_perf_event_output to perf_event_output
table.perf_submit()function is converted tobpf_perf_event_output()(source)bpf_perf_event_outputis implemented byBPF_FUNC_perf_event_output(source)BPF_FUNC_perf_event_outputis an eBPF helper: (source)BPF_FUNC_perf_event_outputis creating thebpf_perf_event_outputprototype:bpf_perf_event_output_proto: (source)bpf_perf_event_output_protois pointing to thebpf_perf_event_outputfunction (source)bpf_perf_event_outputfunction is calling theperf_event_outputfunction (source)